SQL Server’s Extended Events (XE) contain a feature that makes it easy to track down deadlocks. In stark contrast to Profiler, the Extended Events engine is always running, even in production, and has been so since SQL Server 2008.
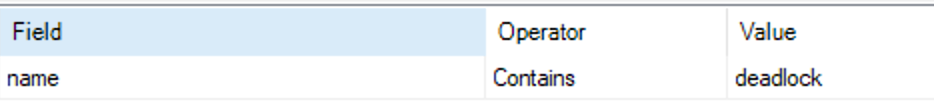
In 2012 XE got a GUI and you can find the always-running session titled “system_health” in SQL Server Management Studio (SSMS) under Object Explorer > Management > Extended Events > system_health. It writes to the ring buffer and an event file. If you expand system_health, click package0.event_file, then filter it for “name contains deadlock” (let’s make it easy), you’ll see all the recent deadlocks in your system.
Click one of the event rows, then click the Deadlocks tab to see information about the objects, indexes, and types of locks involved in the deadlock. It’s easy to spot the victim. In this case three SQL statements were involved in the deadlock.
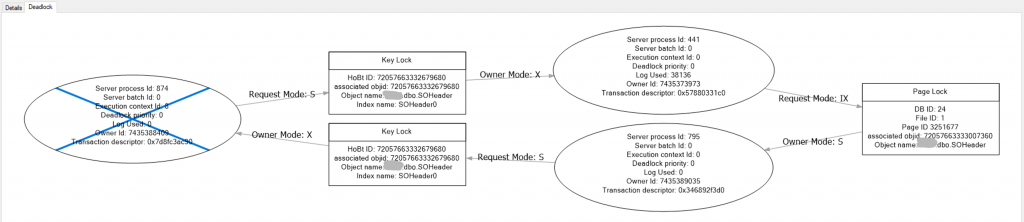
If you click the Details tab, then double-click the Values column, you’ll see the exact SQL statements that were involved in the deadlock. Search for the “Server process ID” or SPID number of the oval with a blue X to identify the victim.
Give it a try the next time a user says the system is getting slow.
And while you’re here, if you’re using a more recent version of SSMS, look at the bottom of the Object Explorer tree. Expand XEvent Profiler. It’s like the default (Standard) or TSQL trace for Profiler, but far better for performance. And IMHO, it’s also easier to use. No need to start a different application and connect.
If you created a filter earlier, clear it. Then double-click TSQL to see live queries. It’s buffered, so you’ll have to wait a bit for it to appear. Stop the trace, then filter on “statement contains select” to see the select statements that ran while you were watching.
If you want to customize the trace, like Profiler, just create a new session under Extended Events. More about that here…